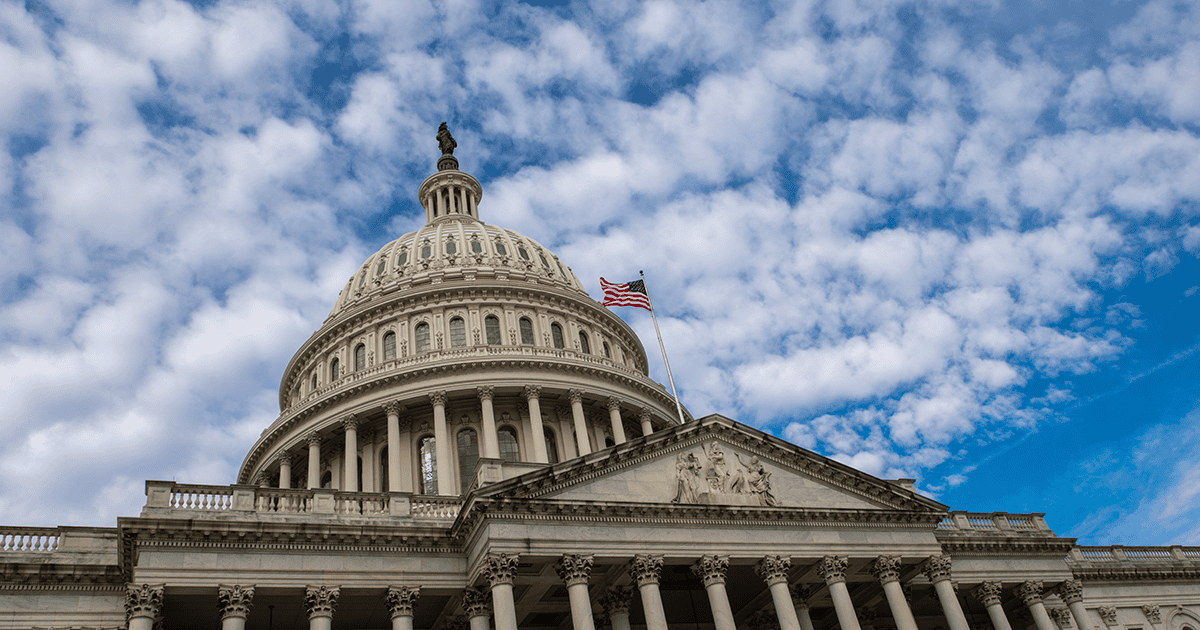
Most research data are conveyed visually through graphs, tables, or images. However, in recent years, converting visual data into auditory data has emerged as a unique adjunctive means to convey information. This process is called sonification and can increase access to information to those with visual impairments. The most visible use of this process has been in the astrological field.
Catchy headlines, such as “What does a blackhole sound like?”, have popped up on social media sites. However, the emerging field of sonification is expanding, and researchers from many fields are contributing to a newly developed archive. The archive is an eclectic mix of disciplines with one thing in common, contributors are translating their findings into soundscapes.
Reference
Data Sonification Archive. https://sonification.design (accessed December 2, 2022).
Recent Posts
NASEM Releases Report on Meaningful Outcomes in Adult Hearing Health Care
The National Academies of Science, Engineering, and Medicine recently released the report “Measuring Meaningful Outcomes for Adult Hearing Health Outcomes.” The report includes the committee’s…
Trump Administration’s FY 2026 Budget Proposes Deep Cuts and Reorganization for HHS
President Donald Trump has released his fiscal year (FY) 2026 budget proposal for the Department of Health and Human Services (HHS). It reflects a dramatic…
Academy and FLAA Advocate Against Risky Hearing Aid Policies
Last week, Florida Senate Bill (SB) 126 passed in the Senate and moved to the House. Initially introduced alongside House Bill (HB) 101 to remove…